
Chief Investigators
Prof. Iain MacGill (UNSW)
Purpose of project
The electricity industry has experienced and continues to experience significant changes that present challenges for managing system security and reliability. Technical challenges and changes to cost and revenue structures emerge as a result of the energy transformation from large scale, dispatchable, centralised coal fired power plants to distributed, non-dispatchable renewables such as wind and solar power. This transition also raises questions about pricing of and access to network services. Solving these new challenges for the benefit of consumers requires new solutions, including new services, new technologies, new pricing and incentives.
However, evidence from smart meter rollouts and other demand-side initiatives in Australia suggests that the current lack of trust between consumers and industry has led to hundreds of millions of dollars in avoidable costs, delays in investment and higher energy bills. Clear and truthful information can assist stakeholders in understanding the changes in the industry better and how those changes can benefit consumers.
In the last 12 months, over 11% of the total electricity consumed in the National Electricity Market was provided by rooftop solar. As consumers generate more of their own electricity through devices like rooftop solar, it drives down the demand as seen by the market operator, and displaces large-scale generation. The evolution of minimum demand is an emerging challenge for the market operator and the operation of the grid. The increasing prevalence of curtailment presents risks and challenges to the development of new renewable projects in the Australian national electricity market, which may adversely impact the speed of deployment of low emissions electricity generation, hampering decarbonisation efforts throughout the economy. Australia is leading the world with the installation of rooftop solar photovoltaic (PV).
Overall, the outcomes that this project will contribute to:
- Developing a foundation for a data management strategy for RACE for 2030 and its projects.
- Developing a common language and terminology to bridge the gap between the demand and supply side of electricity and promote energy literacy through the use of energy visualisation tools
- Assisting in managing the spread of misinterpretation and misinformation in the media through the provision of clear and effective communication on energy trends through the development of energy visualisation tools
Findings
Seven initial concepts were shortlisted in collaboration with the Stakeholder Reference groups for consideration, namely: 1) minimum demand; 2) electric vehicle uptake, charging infrastructure and impact on load profiles; 3) large and small scale curtailment; 4) large energy users and purchasers; 5) industry trust building including consumer sentiment and unlocking reporting data; 6) making use of voltage data and opportunities for data management; and 7) energy workforce jobs, projecting future workforce and market size from energy scenarios.
After further consultation with the Stakeholder Reference Group, four tools were progressed to the prototype stage, namely minimum demand (#1, by UNSW), electric mobility (based on #2, by UNSW) and large-scale curtailment (#3, by UNSW) and small scale (distribution level PV) curtailment (#3, by UTS). These are explored in more detail in the following sections, and more comprehensive details are available in the project report. Numerous changes were made to the tools during the development process, based on detailed user feedback from the Stakeholder Reference Group.
The UTS team developed an interactive explorer to help users understand the current and forecast magnitude of rooftop PV curtailment on distribution networks, and what can be done to address the issue. The primary data used is modelled curtailment forecasts produced by DNSPs (specifically Endeavour Energy and Ausgrid) for the five-year ‘regulatory reset’ investment approval process, run by the Australian Energy Regulator (AER). This was supplemented with contextual background data to aid user understanding of the underlying concepts, including an explanatory YouTube video.
Key messages were that
- Curtailment is currently limited but is forecast to accelerate across the network, as Figures 1 and 2 indicate.
- Not all customers are equally affected, so equity is an important consideration.
- Both networks and customers can act to substantially reduce curtailment.
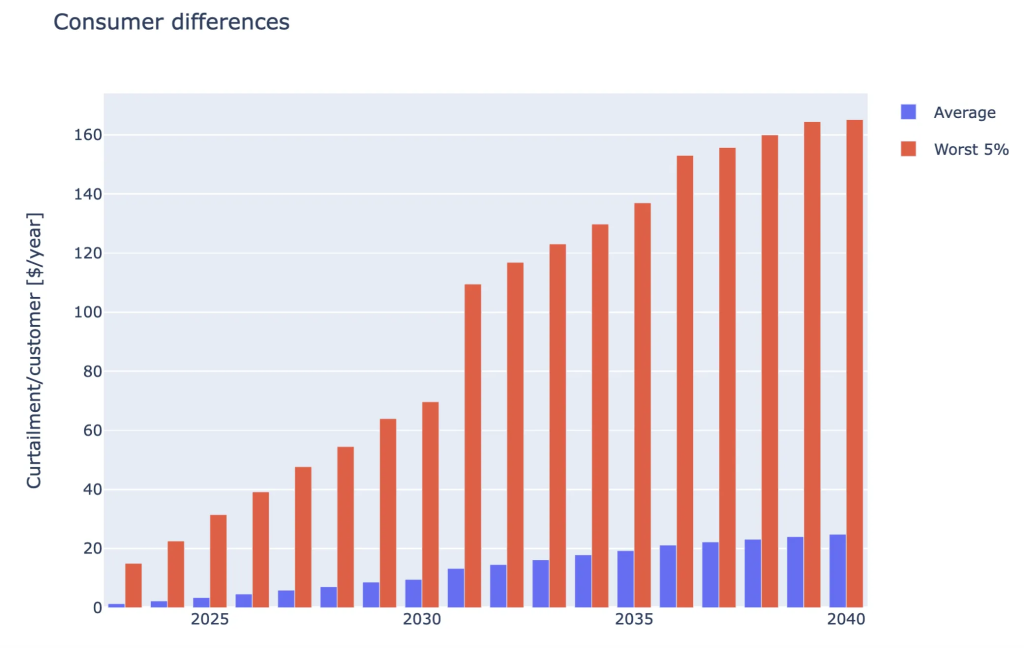
Figure 1: Differential impact of PV curtailment on the worst-served 5% of customers across Endeavour Energy territory
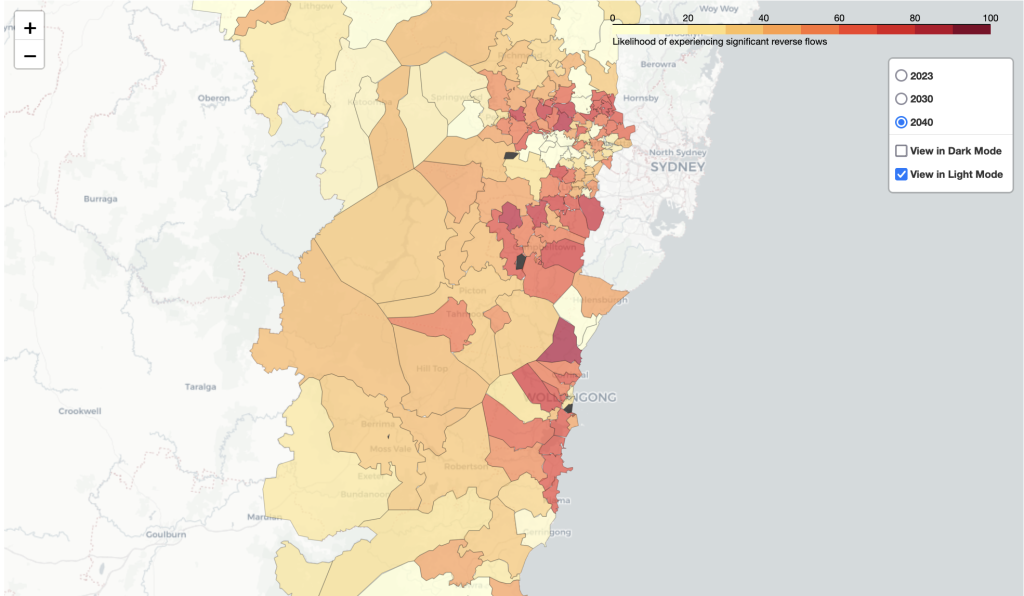
Figure 2: Time series map of reverse energy flows by Zone Substation in Endeavour Energy service territory, 2040
A final visualisation included a map of opportunities for customers, including hot water systems, electricity heat pump hot water systems and EV charging for Endeavour Energy areas.
This tool presents curtailment data through facility-level and regional visualisations, using a range of datasets from AEMO’s “Market Management System” (MMS) to estimate the total renewable energy curtailment occurring in the Australian National Electricity Market (NEM), which covers the eastern states of Australia, by providing a direct estimation of total curtailment through comparison of the “available generation” and “dispatch target” fields. The first visualisation allows selection of in the NEM by region, resource type and identifier, and shows generation and curtailment at a 5-minute resolution, as shown in Figure 3.

Figure 3: Generation (green) and curtailment (pink) at Cathedral Rocks Wind Farm, week of 17-23 April, 2024.
The second visualisation for each facility shows the curtailment on a map of the NEM, as shown in Figure 4, with the potential to zoom in on various regions.
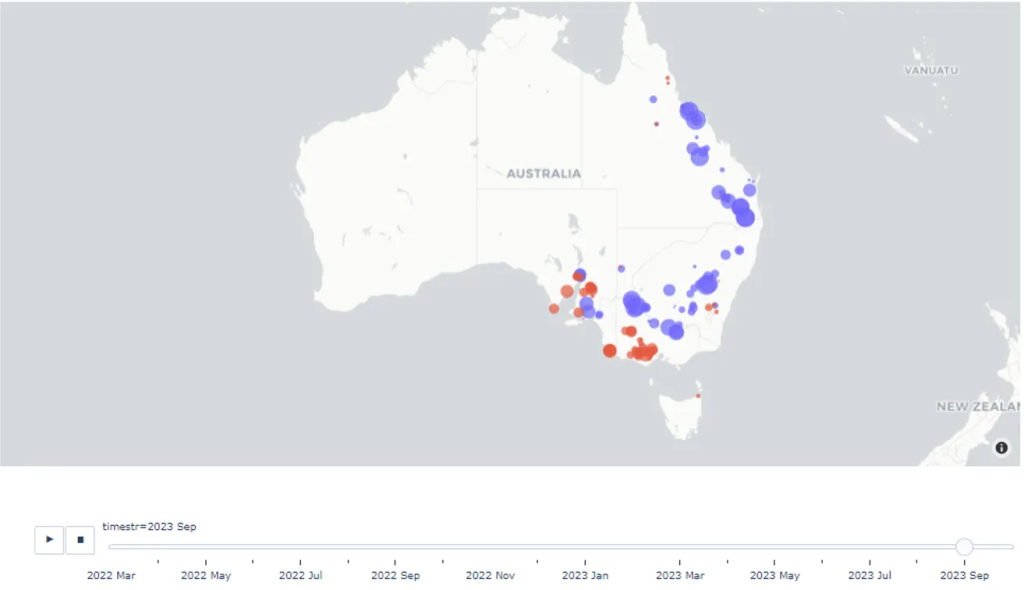
Figure 4: Curtailment in September 2023 for wind (pink) and utility solar (blue) in the NEM.
Regional curtailment was also visualised, allowing selection by region and resource types, with a similar display as the individual generator in Figure 5.
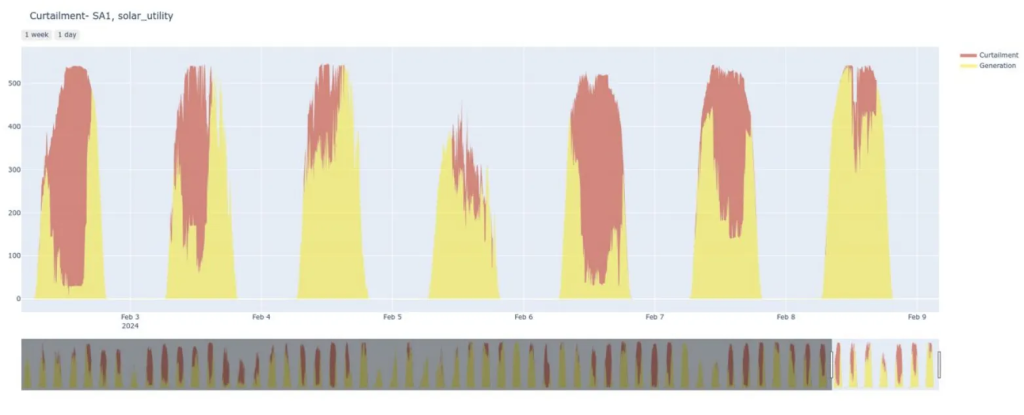
Figure 5: Regional generation (yellow) and curtailment (pink) of utility solar in South Australia during 20-27 March 2024
Another regional curtailment profile was provided by showing the time of day of curtailment for the entire 60 days period, as shown in Figure 6.
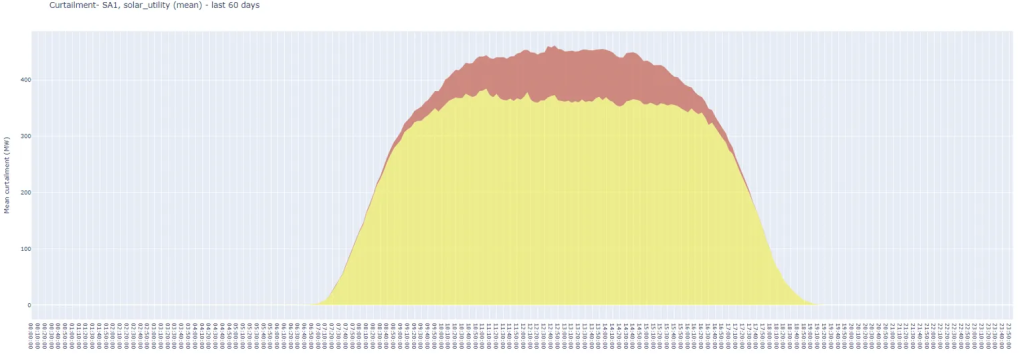
Figure 6: Generation (yellow) and curtailment (pink) of utility solar in South Australia for the last 60 days
This tool aims to illustrate the potential impact of electrification of different transport sectors on the future electricity system, and particularly hourly demand profiles. Figure 7 shows the demand forecast and impact of EV charging profiles, where the region, time span, charging regime, and electrification percentage for each vehicle type are input by the user and the tool estimates the demand.
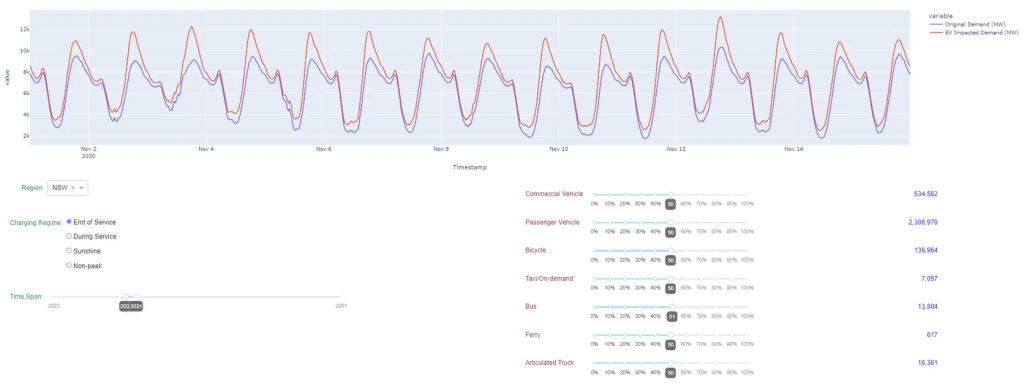
Figure 7: Original (blue) and EV impacted (red) demand on NSW in Nov 2030, for end of service charging for 50% EVs in each vehicle type.
Figure 8 shows the EV traces for a typical year, based on charge rate (kW/average vehicle), transport energy requirements (kW/average vehicle), and percentage of a given fleet connected to the grid via charging infrastructure at a particular time, with additional details provided on the relative contribution of different vehicle types to the overall demand.
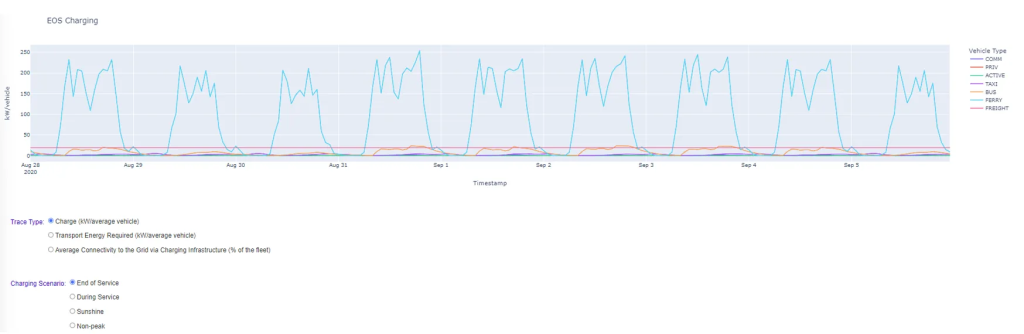
Figure 8: End of service charging for 28Aug-5Sep2020, based on historical usage data and 50% of EVs in each vehicle type.
This tool is intended to help stakeholders better understand the emerging issue of minimum demand in the Australian NEM. Historically, the focus has been on the challenges of managing periods of peak demand given the risks it poses for the secure and reliable provision of electricity, which is a challenge of having sufficient generation to meet demand. Stakeholders have less appreciation of the challenges that low minimum demand poses for secure power system operation, and demand trends over the past decade are making this more challenging.
Minimum demand was visualised by using publicly available historical NEM dispatch and scheduled demand data from AEMO, as well as forward looking demand profiles developed by AEMO as part of their Integrated System Plan process.
A visualisation of annual actual and projected minimum, mean and maximum demand by state, demand projection from the 2022 Integrated System Plan (step change, slow change, progressive change and hydrogen superpower) by state was provided, which indicates that minimum demand falls and peak demand grows in all regions, as shown in Figure 9.
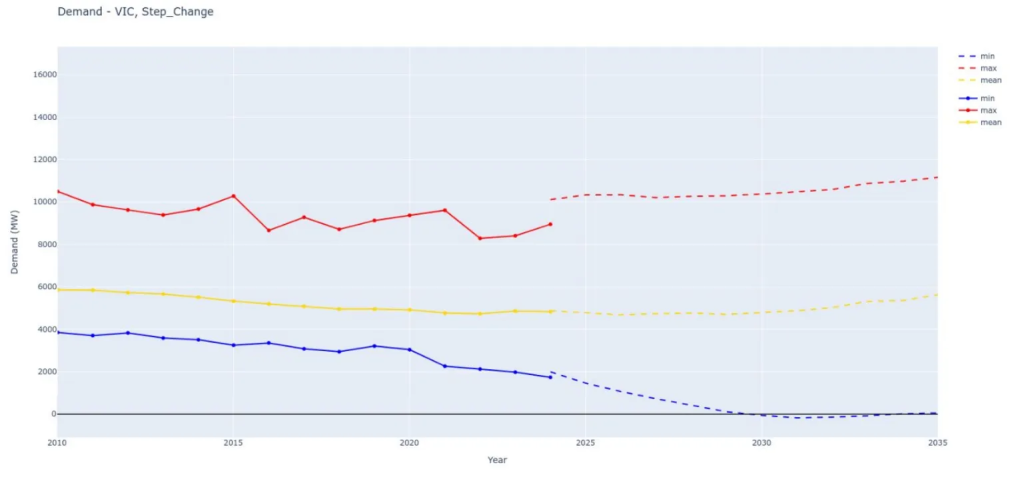
Figure 9: Annual peak, mean and minimum demand in Victoria for step change scenario from ISP.
A more detailed of daily minimum, peak and mean demand profiles was then provided by year, region and scenario, with the dates of historical and projected values out to 2051 provided. This is shown in Figure 10 for South Australia in 2024, where the minimum demand is expected to be negative between 10.15am and 13:45 on 5 November 2024 and peak demand is expected to be nearly 3,500 MW and occur between 18:30 and 19:30 on 18 January 2024.
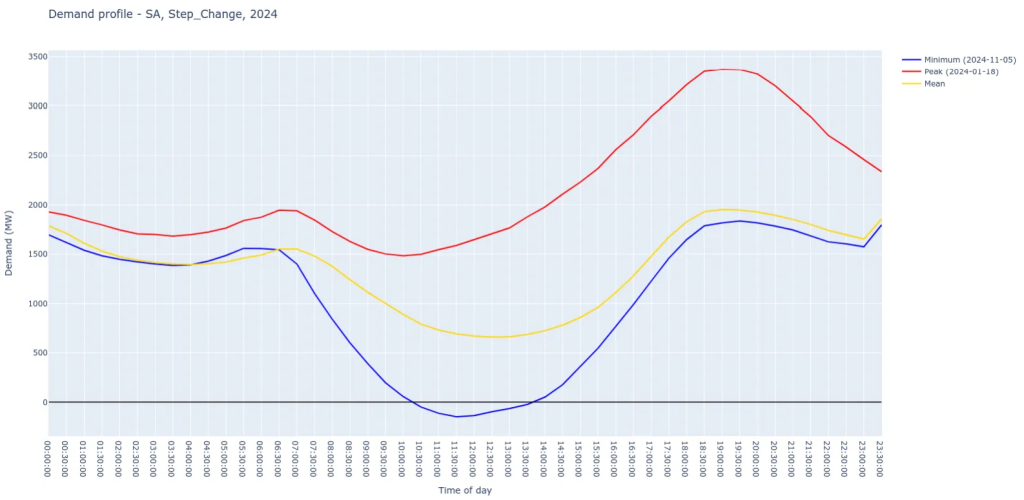
Figure 10: Projected peak, mean and minimum demand for South Australia in 2024, including dates of minimum and peak demand in the legend.
The final demand visualisation was for projected regional demand over time, from 2023-2051, showing the peak, mean and minimum demand for different demand projections from the 2022 ISP. Figure 11 shows South Australia minimum demand and the time of day it occurs, which clearly indicates the challenge ahead of managing system minimum demand.

Figure 11: South Australia minimum daily load profile demand projections for 2023-2051, based on different 2022 ISP development scenarios.
Potential impact of project
This project has laid the foundation of a proposed approach to convey complex information in a way that key groups of energy stakeholders understand, which will lead to increased awareness, understanding and informed decision-making. This can now be used to promote innovation in consumer-driven and creative future energy solutions and allow consumers to better understand and navigate the coming energy transition. This research can now be used complement and enhance existing trust measurement and building activities, e.g., annual Energy Consumers Australia’s Consumer Sentiment survey and the Energy Charter.
The expected short-term outcomes from the project therefore include:
- Improved consumer trust and understanding on key trends and changes taking place in the electricity system
- Improved decision-making support for energy stakeholders based on near real-time evidence and data
- Established foundations for effective consumer and stakeholder communication around DER integration and access to network services
- Informed industry stakeholder engagement in regulatory reform to understand emerging issues and develop strategies to mitigate / manage them.
In the long term, the effective communication of complex energy data is expected to support managing of security and reliability challenges faced by the rapid uptake of distributed energy resources and the technical and pricing challenges it raises. The tools developed can assist in developing pathways for implementing load-balancing strategies that benefit the network and consumers and can be used as a common and unified platform to bring energy users together.
Through addressing key institutional challenges faced by the electricity network today, the use of the tools developed in this project will indirectly contribute to RACE for 2030 impact indicators such as reducing customer energy bills and carbon emissions.
Project partners – industry and research
University of New South Wales (UNSW) (Lead), Australian Energy Market Operator, Ausgrid, DEECA (VIC), Energy OS, Endeavour Energy, Powerlink, University of Technology Sydney (UTS)
Industry Reference Group members
BlueScope Steel, DEECA (VIC), Energy Consumers Australia (ECA), Endevour Energy, Energy Security Board,
Published Report

Status
- Completed
Project Leaders
- Iain MacGill, UNSW
ETV Tools
Project Code
0266
Related Projects
Business Power Flex
Chief Investigators A/Prof Alexandr Akimov (Griffith University) David Roche (UTS) Purpose of project Our electricity grid is changing. Australia’s transition to a renewables powered grid...

Load flexing of industrial refrigeration systems at abattoirs
Chief Investigators Jarrod Leak (A2EP) Purpose of project The project researched the feasibility of abattoirs flexing the electrical demand of their refrigeration plants by using advanced...

Improving the performance and potential applications of PCM storage for flexible demand in the HVAC-R industry
Chief Investigators Prof. Frank Bruno (Adelaide University) Purpose of project Heating Ventilation Air-conditioning Cooling and Refrigeration (HVAC-R) uses over 22% of Australia’s electricity and is a...
Completed
Flexible demand and demand control technology and development
Chief Investigators Dr Stephen White (CSIRO) Purpose of project This Opportunity Assessment project identified sources of flexible demand (FD) in Australia and evaluated the opportunity to unlock demand side participation...
24/7 TRUZERO (Tracking Renewables Utilisation for Zero Emission Reporting and Operation)
Chief Investigators A/Prof. Anna Bruce (UNSW) Many businesses are reducing their electricity-related emissions through renewables power purchase agreements (PPAs). However, there is increasing scrutiny...
Energy flexibility for water corporations
Chief Investigators Prof Rebecca Yang (RMIT) Purpose of project Water corporations in both New South Wales and Victoria have committed to a net-zero carbon...

Data innovation for zero carbon buildings
SUPERVISORS Hongda Tian (UTS) Hao Huang (Buildings Alive) Craig Roussac (Buildings Alive) DESCRIPTION According to the IEA, for the international community to meet the goals of the Paris Agreement,...
Fast-track to Net Zero Carbon buildings
Supervisors Dr Mike Roberts, UNSW Craig Roussac, Buildings Alive DESCRIPTION Like major economies and institutions around the world, owners and operators of large commercial, residential...
Maximising renewable energy for water corporations through machine learning, peer-to-peer trading and demand management
Supervisors Dr Rebecca Yang and Dr Kazi Hasan (RMIT) Ruben Muller (Sydney Water) The project Water corporations have extensive electricity demands, which lead to high energy bills and...